文章内容如有错误或排版问题,请提交反馈,非常感谢!
在Python中经常使用matplotlib画图,为了让图像显示的更加好看,经常需要对图表点、线形状及颜色进行设置。为了避免遗忘,整理相关的信息。
先来看看matplotlib画图方法的官方说明:
from matplotlib import pyplot as plt
help(plt.plot)
Help on function plot in module matplotlib.pyplot:

plot(*args, **kwargs)
Plot y versus x as lines and/or markers.

Call signatures::

    plot([x], y, [fmt], data=None, **kwargs)
    plot([x], y, [fmt], [x2], y2, [fmt2], ..., **kwargs)

The coordinates of the points or line nodes are given by *x*, *y*.

The optional parameter *fmt* is a convenient way for defining basic
formatting like color, marker and linestyle. It's a shortcut string
notation described in the *Notes* section below.

>>> plot(x, y)        # plot x and y using default linestyle and color
>>> plot(x, y, 'bo')  # plot x and y using blue circle markers
>>> plot(y)           # plot y using x as index array 0..N-1
>>> plot(y, 'r+')     # ditto, but with red plusses

You can use `.Line2D` properties as keyword arguments for more
control on the appearance. Line properties and *fmt* can be mixed.
The following two calls yield identical results:

>>> plot(x, y, 'go--', linewidth=2, markersize=12)
>>> plot(x, y, color='green', marker='o', linestyle='dashed',
        linewidth=2, markersize=12)

When conflicting with *fmt*, keyword arguments take precedence.

**Plotting labelled data**

There's a convenient way for plotting objects with labelled data (i.e.
data that can be accessed by index ``obj['y']``). Instead of giving
the data in *x* and *y*, you can provide the object in the *data*
parameter and just give the labels for *x* and *y*::

>>> plot('xlabel', 'ylabel', data=obj)

All indexable objects are supported. This could e.g. be a `dict`, a
`pandas.DataFame` or a structured numpy array.


**Plotting multiple sets of data**

There are various ways to plot multiple sets of data.

- The most straightforward way is just to call `plot` multiple times.
Example:

>>> plot(x1, y1, 'bo')
>>> plot(x2, y2, 'go')

- Alternatively, if your data is already a 2d array, you can pass it
directly to *x*, *y*. A separate dataset will be drawn for every
column.

Example: an array ``a`` where the first column represents the *x*
values and the other columns are the *y* columns::

>>> plot(a[0], a[1:])

- The third way is to specify multiple sets of *[x]*, *y*, *[fmt]*
groups::

>>> plot(x1, y1, 'g^', x2, y2, 'g-')

In this case, any additional keyword argument applies to all
datasets. Also this syntax cannot be combined with the *data*
parameter.

By default, each line is assigned a different style specified by a
'style cycle'. The *fmt* and line property parameters are only
necessary if you want explicit deviations from these defaults.
Alternatively, you can also change the style cycle using the
'axes.prop_cycle' rcParam.

Parameters
----------
x, y: array-like or scalar
    The horizontal/vertical coordinates of the data points.
    *x* values are optional. If not given, they default to
    ``[0, ..., N-1]``.

    Commonly, these parameters are arrays of length N. However,
    scalars are supported as well (equivalent to an array with
    constant value).

    The parameters can also be 2-dimensional. Then, the columns
    represent separate datasets.

fmt: str, optional
    A format string, e.g. 'ro' for red circles. See the *Notes*
    section for a full description of the format strings.

    Format strings are just an abbreviation for quickly setting
    basic line properties. All of these and more can also be
    controlled by keyword arguments.

data: indexable object, optional
    An object with labelled data. If given, provide the label names to
    plot in *x* and *y*.

.. note::
    Technically there's a slight ambiguity in calls where the
    second label is a valid *fmt*. `plot('n', 'o', data=obj)`
    could be `plt(x, y)` or `plt(y, fmt)`. In such cases,
    the former interpretation is chosen, but a warning is issued.
    You may suppress the warning by adding an empty format string
    `plot('n', 'o', '', data=obj)`.


Other Parameters
----------------
scalex, scaley: bool, optional, default: True
    These parameters determined if the view limits are adapted to
    the data limits. The values are passed onto `autoscale_view`.

**kwargs: `.Line2D` properties, optional
    *kwargs* are used to specify properties like a line label (for
    auto legends), linewidth, antialiasing, markerface color.
    Example::

>>> plot([1, 2, 3], [1, 2, 3], 'go-', label='line1', linewidth=2)
>>> plot([1, 2, 3], [1, 4, 9], 'rs', label='line2')

    If you make multiple lines with one plot command, the kwargs
    apply to all those lines.Here is a list of available `.Line2D` properties:

agg_filter: a filter function, which takes a (m, n, 3) float array and a dpi value, and returns a (m, n, 3) array
alpha: float (0.0 transparent through 1.0 opaque)
animated: bool
antialiased or aa: bool
clip_box: a `.Bbox` instance
clip_on: bool
clip_path: [(`~matplotlib.path.Path`, `.Transform`)|`.Patch`|None]
color or c: any matplotlib color
contains: a callable function
dash_capstyle: ['butt'|'round'|'projecting']
dash_joinstyle: ['miter'|'round'|'bevel']
dashes: sequence of on/off ink in points
drawstyle: ['default'|'steps'|'steps-pre'|'steps-mid'|'steps-post']
figure: a `.Figure` instance
fillstyle: ['full'|'left'|'right'|'bottom'|'top'|'none']
gid: an id string
label: object
linestyle or ls: ['solid'|'dashed','dashdot','dotted'|(offset, on-off-dash-seq)|``'-'``|``'--'``|``'-.'``|``':'``|``'None'``|``''``|``''``]
linewidth or lw: float value in points
marker: :mod:`A valid marker style<matplotlib.markers>`
markeredgecolor or mec: any matplotlib color
markeredgewidth or mew: float value in points
markerfacecolor or mfc: any matplotlib color
markerfacecoloralt or mfcalt: any matplotlib color
markersize or ms: float
markevery: [None|int|length-2 tuple of int|slice|list/array of int|float|length-2 tuple of float]
path_effects: `.AbstractPathEffect`
picker: float distance in points or callable pick function ``fn(artist, event)``
pickradius: float distance in points
rasterized: bool or None
sketch_params: (scale: float, length: float, randomness: float)
snap: bool or None
solid_capstyle: ['butt'|'round'|'projecting']
solid_joinstyle: ['miter'|'round'|'bevel']
transform: a:class:`matplotlib.transforms.Transform` instance
url: a url string
visible: bool
xdata: 1D array
ydata: 1D array
zorder: float

Returns
-------
lines
A list of `.Line2D` objects representing the plotted data.


See Also
--------
scatter: XY scatter plot with markers of varying size and/or color (
sometimes also called bubble chart).


Notes
-----
**Format Strings**

A format string consists of a part for color, marker and line::

fmt = '[color][marker][line]'

Each of them is optional. If not provided, the value from the style
cycle is used. Exception: If ``line`` is given, but no ``marker``,
the data will be a line without markers.

**Colors**

The following color abbreviations are supported:

============================================
character color
============================================
``'b'`` blue
``'g'`` green
``'r'`` red
``'c'`` cyan
``'m'`` magenta
``'y'`` yellow
``'k'`` black
``'w'`` white
============================================

If the color is the only part of the format string, you can
additionally use any `matplotlib.colors` spec, e.g. full names
(``'green'``) or hex strings (``'#008000'``).

**Markers**

============================================
character description
============================================
``'.'`` point marker
``','`` pixel marker
``'o'`` circle marker
``'v'`` triangle_down marker
``'^'`` triangle_up marker
``'<'`` triangle_left marker
``'>'`` triangle_right marker
``'1'`` tri_down marker
``'2'`` tri_up marker
``'3'`` tri_left marker
``'4'`` tri_right marker
``'s'`` square marker
``'p'`` pentagon marker
``'*'`` star marker
``'h'`` hexagon1 marker
``'H'`` hexagon2 marker
``'+'`` plus marker
``'x'`` x marker
``'D'`` diamond marker
``'d'`` thin_diamond marker
``'|'`` vline marker
``'_'`` hline marker
============================================

**Line Styles**

============================================
character description
============================================
``'-'`` solid line style
``'--'`` dashed line style
``'-.'`` dash-dot line style
``':'`` dotted line style
============================================

Example format strings::

'b'    # blue markers with default shape
'ro'   # red circles
'g-'   # green solid line
'--'   # dashed line with default color
'k^:'  # black triangle_up markers connected by a dotted line

.. note::
In addition to the above described arguments, this function can take a
**data** keyword argument. If such a **data** argument is given, the
following arguments are replaced by **data[<arg>]**:

*All arguments with the following names: 'x', 'y'.
颜色
支持的颜色缩写:
- ‘b’:蓝色(blue)
- ‘g’:绿色(green)
- ‘r’:红色(red)
- ‘c’:青色(cyan)
- ‘m’:品红(magenta)
- ‘y’:黄色(yellow)
- ‘k’:黑色(black)
- ‘w’:白色(white)
另外的颜色可以使用 matplotlib.colors 定义的内容:
import matplotlib
?matplotlib.colors
A module for converting numbers or color arguments to *RGB* or *RGBA*

*RGB* and *RGBA* are sequences of, respectively, 3 or 4 floats in the
range 0-1.

This module includes functions and classes for color specification
conversions, and for mapping numbers to colors in a 1-D array of colors called
a colormap. Colormapping typically involves two steps: a data array is first
mapped onto the range 0-1 using an instance of :class:`Normalize` or of a
subclass; then this number in the 0-1 range is mapped to a color using an
instance of a subclass of :class:`Colormap`. Two are provided here:
:class:`LinearSegmentedColormap`, which is used to generate all the built-in
colormap instances, but is also useful for making custom colormaps, and
:class:`ListedColormap`, which is used for generating a custom colormap from a
list of color specifications.

The module also provides functions for checking whether an object can be
interpreted as a color (:func:`is_color_like`), for converting such an object
to an RGBA tuple (:func:`to_rgba`) or to an HTML-like hex string in the
`#rrggbb` format (:func:`to_hex`), and a sequence of colors to an `(n,4)`
RGBA array (:func:`to_rgba_array`). Caching is used for efficiency.

Matplotlib recognizes the following formats to specify a color:

* an RGB or RGBA tuple of float values in ``[0,1]`` (e.g., ``(0.1,0.2,0.5)``
or ``(0.1,0.2,0.5,0.3)``);
* a hex RGB or RGBA string (e.g., ``'#0F0F0F'`` or ``'#0F0F0F0F'``);
* a string representation of a float value in ``[0,1]`` inclusive for gray
level (e.g., ``'0.5'``);
* one of ``{'b','g','r','c','m','y','k','w'}``;
* a X11/CSS4 color name;
* a name from the `xkcd color survey<https://xkcd.com/color/rgb/>`__;
prefixed with ``'xkcd:'`` (e.g., ``'xkcd:skyblue'``);
* one of ``{'tab:blue','tab:orange','tab:green',
'tab:red','tab:purple','tab:brown','tab:pink',
'tab:gray','tab:olive','tab:cyan'}`` which are the Tableau Colors from the
'T10' categorical palette (which is the default color cycle);
* a "CN" color spec, i.e. `'C'` followed by a single digit, which is an index
into the default property cycle (``matplotlib.rcParams['axes.prop_cycle']``);
the indexing occurs at artist creation time and defaults to black if the
cycle does not include color.

All string specifications of color, other than "CN", are case-insensitive.
Matplotlib可以识别如下格式的颜色:
- 浮点形式的RGB或RGBA元组,例如:(0.1,0.2,0.5)或(0.1,0.2,0.5,0.3)
- 16进制的RGB或RGBA字符串,例如:’#0F0F0F’或’#0F0F0F0F’
- `[0,1]之间的小数作为的灰度值,例如:’0.5′
- {‘b’,’g’,’r’,’c’,’m’,’y’,’k’,’w’}中间的一个颜色
- X11/CSS4规定中的颜色名称
- Xkcd中指定的颜色名称,例如:’xkcd:skyblue’
- Tableau’T10’调色板中的颜色{‘tab:blue’,’tab:orange’,’tab:green’,’tab:red’,’tab:purple’,’tab:brown’,’tab:pink’,’tab:gray’,’tab:olive’,’tab:cyan’}
- “CN”格式颜色循环,其中为数字,对应的颜色为matplotlib.rcParams[‘axes.prop_cycle’]重点的值:cycler(‘color’,[‘#1f77b4′,’#ff7f0e’,’#2ca02c’,’#d62728′,’#9467bd’,’#8c564b’,’#e377c2′,’#7f7f7f’,’#bcbd22′,’#17becf’])
标记点
支持的类型:
- ‘.’:点(point marker)
- ‘,’:像素点(pixel marker)
- ‘o’:圆形(circle marker)
- ‘v’:朝下三角形(triangle_down marker)
- ‘^’:朝上三角形(triangle_up marker)
- ‘<‘:朝左三角形(triangle_left marker)
- ‘>’:朝右三角形(triangle_right marker)
- ‘1’:(tri_down marker)
- ‘2’:(tri_up marker)
- ‘3’:(tri_left marker)
- ‘4’:(tri_right marker)
- ‘s’:正方形(square marker)
- ‘p’:五边星(pentagon marker)
- ‘*’:星型(star marker)
- ‘h’:1号六角形(hexagon1 marker)
- ‘H’:2号六角形(hexagon2 marker)
- ‘+’:+号标记(plus marker)
- ‘x’:x号标记(x marker)
- ‘D’:菱形(diamond marker)
- ‘d’:小型菱形(thin_diamond marker)
- ‘_’:水平线形(hlinemarker)
‘|’:垂直线形(vlinemarker)
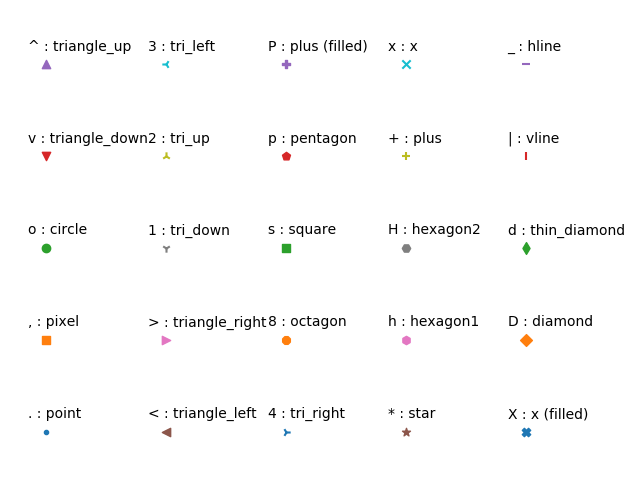
标记点可打印出来的具体形状为:
import matplotlib.pyplot as plt

markers = ['.', ',', 'o', 'v', '^', '<', '>', '1', '2', '3', '4', '8', 's', 'p', 'P', '*', 'h', 'H', '+', 'x', 'X', 'D',
'd', '|', '_']
descriptions = ['point', 'pixel', 'circle', 'triangle_down', 'triangle_up', 'triangle_left', 'triangle_right',
'tri_down', 'tri_up', 'tri_left', 'tri_right', 'octagon', 'square', 'pentagon', 'plus(filled)', 'star',
'hexagon1', 'hexagon2', 'plus', 'x', 'x(filled)', 'diamond', 'thin_diamond', 'vline', 'hline']
x = []
y = []
for i in range(5):
    for j in range(5):
        x.append(i)
        y.append(j)
plt.figure()
for i, j, m, l in zip(x, y, markers, descriptions):
    plt.scatter(i, j, marker=m)
    plt.text(i-0.15, j+0.15, s=m+':'+l)
plt.axis([-0.1, 4.8, -0.1, 4.5])
plt.tight_layout()
plt.axis('off')
plt.show()
线型
支持的线型:
- ‘-‘:实线(solidlinestyle)
- ‘–‘:虚线(dashedlinestyle)
- ‘-.’:点划线(dash-dotlinestyle)
- ‘:’:点线(dottedlinestyle)
参考链接: