文章内容如有错误或排版问题,请提交反馈,非常感谢!
Cartopy是一个基于Matplotlib构建的Python库,专门用于地理空间数据处理和地图绘制。它将Matplotlib强大的绘图功能与专业的地理空间数据处理能力相结合,为科研工作者、数据分析师和开发者提供了一个高效、灵活的地理可视化解决方案。
核心特性与优势
丰富的地图投影系统
Cartopy支持多种地图投影方式,包括:
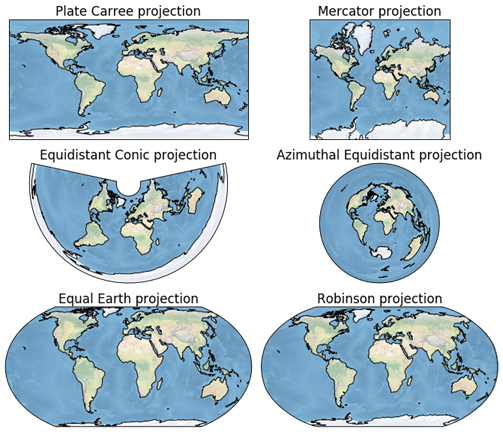
- 等距圆柱投影(PlateCarree):最基本投影,适用于小范围区域
- 墨卡托投影(Mercator):保持方向不变,适合航海图和台风路径图
- 兰勃特投影(LambertCylindrical):适合中纬度大范围区域
- 正射投影(Orthographic):呈现从太空看地球的立体效果
- 罗宾逊投影(Robinson)和摩尔魏特投影(Mollweide):常用于世界地图
内置地理要素库
Cartopy提供了预定义的地理特征,包括:
- 海岸线(COASTLINE)
- 陆地(LAND)和海洋(OCEAN)
- 河流(RIVERS)和湖泊(LAKES)
- 国家边界(BORDERS)
- 州/省边界(STATES)
强大的数据可视化能力
- 支持等值线图、填充图、散点图等多种可视化形式
- 可与NumPy数组、Pandas DataFrame无缝集成
- 支持自定义颜色映射和样式
开放源代码与活跃社区
作为开源项目,Cartopy拥有活跃的社区支持和丰富的文档资源。
安装与配置
基础安装
# 使用pip安装
pip install cartopy

# 使用conda安装(推荐)
conda install -c conda-forge cartopy
安装依赖库
# 建议安装的配套库
pip install matplotlib numpy pandas
pip install geopandas  # 用于处理Shapefile和GeoJSON
基础使用示例
示例1:创建基本世界地图
import matplotlib.pyplot as plt
import cartopy.crs as ccrs
import cartopy.feature as cfeature

# 创建图形和GeoAxes
fig = plt.figure(figsize=(12, 8))
ax = fig.add_subplot(1, 1, 1, projection=ccrs.PlateCarree())

# 添加地理要素
ax.add_feature(cfeature.LAND, color='lightgray')
ax.add_feature(cfeature.OCEAN, color='lightblue')
ax.add_feature(cfeature.COASTLINE, linewidth=0.8)
ax.add_feature(cfeature.BORDERS, linestyle=':', linewidth=0.5)

# 设置全局视图
ax.set_global()

# 添加网格线
ax.gridlines(draw_labels=True, linestyle='--', alpha=0.7)

plt.title('World Map with Cartopy')
plt.show()
示例2:创建区域地图
# 聚焦中国区域
fig = plt.figure(figsize=(10, 8))
ax = fig.add_subplot(1, 1, 1, projection=ccrs.PlateCarree())

# 设置中国区域范围 [西经, 东经, 南纬, 北纬]
ax.set_extent([70, 140, 15, 55], crs=ccrs.PlateCarree())

# 添加详细地理要素
ax.add_feature(cfeature.COASTLINE, linewidth=1.0)
ax.add_feature(cfeature.RIVERS.with_scale('50m'), linewidth=0.5, color='blue')
ax.add_feature(cfeature.LAKES.with_scale('50m'), alpha=0.5, color='blue')

# 自定义网格线
from cartopy.mpl.ticker import LongitudeFormatter, LatitudeFormatter

ax.set_xticks(range(70, 141, 10), crs=ccrs.PlateCarree())
ax.set_yticks(range(15, 56, 10), crs=ccrs.PlateCarree())
ax.xaxis.set_major_formatter(LongitudeFormatter(zero_direction_label=True))
ax.yaxis.set_major_formatter(LatitudeFormatter())

ax.gridlines(linestyle='--', color='gray', alpha=0.5)

plt.title('China Regional Map')
plt.show()
进阶功能示例
示例3:使用不同投影
# 创建不同投影的地图
projections = [
    ('PlateCarree', ccrs.PlateCarree()),
    ('Mercator', ccrs.Mercator()),
    ('LambertCylindrical', ccrs.LambertCylindrical(central_longitude=105)),
    ('Orthographic', ccrs.Orthographic(central_longitude=105, central_latitude=35))
]

fig, axes = plt.subplots(2, 2, figsize=(15, 12),
                         subplot_kw={'projection': projections[1]})

for idx, (name, proj) in enumerate(projections):
    ax = axes[idx//2, idx%2]
    ax = plt.subplot(2, 2, idx+1, projection=proj)
    ax.add_feature(cfeature.COASTLINE)
    ax.add_feature(cfeature.BORDERS, linestyle=':', linewidth=0.5)
    ax.set_title(f'{name} Projection')
    if name == 'Orthographic':
        ax.set_global()

plt.tight_layout()
plt.show()
示例4:数据可视化 – 等值线填充图
import numpy as np

# 生成模拟温度数据
lon = np.linspace(70, 140, 100)
lat = np.linspace(15, 55, 80)
lon_mesh, lat_mesh = np.meshgrid(lon, lat)

# 模拟温度场(随纬度变化)
temperature = 25 + 15 * np.cos(np.radians(lat_mesh)) + \
              5 * np.sin(np.radians(2 * lon_mesh))

# 创建地图
fig = plt.figure(figsize=(12, 8))
ax = fig.add_subplot(1, 1, 1, projection=ccrs.PlateCarree())
ax.set_extent([70, 140, 15, 55])

# 绘制等值线填充图
contour = ax.contourf(lon_mesh, lat_mesh, temperature, 60,
                      transform=ccrs.PlateCarree(),
                      cmap='RdBu_r', alpha=0.8)

# 添加海岸线
ax.add_feature(cfeature.COASTLINE, linewidth=1.0)

# 添加色标
cbar = plt.colorbar(contour, ax=ax, shrink=0.8, pad=0.05)
cbar.set_label('Temperature (°C)')

plt.title('Temperature Distribution over China')
plt.show()
示例5:绘制轨迹线
# 定义城市坐标
cities = {
    'Beijing': (116.4, 39.9),
    'Shanghai': (121.5, 31.2),
    'Guangzhou': (113.3, 23.1),
    'Chengdu': (104.1, 30.6)
}

fig = plt.figure(figsize=(10, 8))
ax = fig.add_subplot(1, 1, 1, projection=ccrs.PlateCarree())
ax.set_extent([100, 125, 20, 45])

# 添加底图
ax.add_feature(cfeature.COASTLINE)
ax.add_feature(cfeature.LAND, color='lightgray', alpha=0.3)

# 绘制城市点和连接线
for name, (lon, lat) in cities.items():
    ax.plot(lon, lat, 'ro', markersize=8,
            transform=ccrs.PlateCarree())
    ax.text(lon+0.5, lat+0.5, name,
            transform=ccrs.PlateCarree(),
            fontsize=10, fontweight='bold')

# 绘制大圆航线(最短路径)
ax.plot([cities['Beijing'][0], cities['Shanghai'][0]],
        [cities['Beijing'][1], cities['Shanghai'][1]],
        color='blue', linewidth=2, linestyle='--',
        transform=ccrs.Geodetic(),
        label='Beijing-Shanghai Great Circle')

plt.legend()
plt.title('Major Cities in China with Flight Path')
plt.show()
自定义图层与高级功能
示例6:加载自定义Shapefile数据
import geopandas as gpd

# 加载自定义Shapefile(需要先下载数据)
try:
    # 示例:加载中国省级边界
    gdf = gpd.read_file('path/to/china_provinces.shp')

    fig = plt.figure(figsize=(12, 10))
    ax = fig.add_subplot(1, 1, 1, projection=ccrs.PlateCarree())
    ax.set_extent([70, 140, 15, 55])

    # 绘制省级边界
    gdf.plot(ax=ax, facecolor='none',
             edgecolor='darkblue', linewidth=0.8,
             transform=ccrs.PlateCarree())

    # 添加底图要素
    ax.add_feature(cfeature.COASTLINE, linewidth=1.0)
    ax.add_feature(cfeature.RIVERS.with_scale('50m'),
                   linewidth=0.5, color='blue')

    plt.title('China Provincial Boundaries')
    plt.show()

except FileNotFoundError:
    print("请确保Shapefile文件路径正确")
示例7:创建专题地图
# 创建人口密度专题地图示例
fig = plt.figure(figsize=(14, 10))

# 创建主地图
ax1 = fig.add_subplot(1, 2, 1, projection=ccrs.PlateCarree())
ax1.set_extent([70, 140, 15, 55])

# 模拟人口密度数据
population_density = np.random.rand(80, 100) * 500

# 绘制人口密度
im = ax1.pcolormesh(lon_mesh, lat_mesh, population_density,
                    transform=ccrs.PlateCarree(),
                    cmap='YlOrRd', shading='auto')

ax1.add_feature(cfeature.COASTLINE, linewidth=1.0)
ax1.add_feature(cfeature.BORDERS, linestyle=':', linewidth=0.5)

# 添加色标
cbar1 = plt.colorbar(im, ax=ax1, shrink=0.8)
cbar1.set_label('Population Density (persons/km²)')
ax1.set_title('Population Density Map')

# 创建插入小图(南海诸岛)
ax2 = fig.add_axes([0.72, 0.15, 0.25, 0.25],
                   projection=ccrs.PlateCarree())
ax2.set_extent([105, 125, 0, 25])
ax2.add_feature(cfeature.COASTLINE, linewidth=0.8)
ax2.add_feature(cfeature.LAND, color='lightgray')
ax2.set_title('South China Sea Islands')

plt.tight_layout()
plt.show()
实用技巧与注意事项
- 安装问题解决
# 使用国内镜像加速安装
pip install cartopy -i https://pypi.tuna.tsinghua.edu.cn/simple

# 安装特定版本
pip install cartopy==0.21.1
- 坐标轴标签优化
# 解决非矩形投影的坐标轴标签问题
from cartopy.mpl.ticker import LongitudeFormatter, LatitudeFormatter

fig = plt.figure(figsize=(10, 8))
ax = fig.add_subplot(1, 1, 1, projection=ccrs.LambertCylindrical())

# 添加地理要素
ax.add_feature(cfeature.COASTLINE)

# 设置坐标轴格式
ax.set_xticks(range(-180, 181, 30), crs=ccrs.PlateCarree())
ax.set_yticks(range(-90, 91, 30), crs=ccrs.PlateCarree())
ax.xaxis.set_major_formatter(LongitudeFormatter())
ax.yaxis.set_major_formatter(LatitudeFormatter())

plt.show()
- 性能优化建议
# 使用较低分辨率数据提高性能
ax.add_feature(cfeature.COASTLINE.with_scale('110m'))  # 110m分辨率
ax.add_feature(cfeature.COASTLINE.with_scale('50m'))   # 50m分辨率
ax.add_feature(cfeature.COASTLINE.with_scale('10m'))   # 10m分辨率(最详细)
- 地图保存与导出
# 高质量保存地图
fig.savefig('high_quality_map.png', dpi=300, bbox_inches='tight')
fig.savefig('vector_map.pdf', format='pdf', bbox_inches='tight')

# 透明背景保存
fig.savefig('transparent_map.png', dpi=300,
            bbox_inches='tight', transparent=True)
典型工作流程
导入必要库
import matplotlib.pyplot as plt
import cartopy.crs as ccrs
import cartopy.feature as cfeature
import numpy as np
创建地图投影和坐标轴
fig = plt.figure(figsize=(width, height))
ax = fig.add_subplot(1, 1, 1, projection=selected_projection)
添加基础地理要素
ax.add_feature(cfeature.COASTLINE)
ax.add_feature(cfeature.LAND, color='color')
ax.add_feature(cfeature.OCEAN, color='color')
设置地图范围
ax.set_extent([west, east, south, north], crs=ccrs.PlateCarree())
绘制数据
# 确保正确设置transform参数
ax.plot(x_data, y_data, transform=data_crs)
ax.contourf(x_grid, y_grid, z_data, transform=data_crs)
美化地图
ax.gridlines(draw_labels=True)
ax.set_title('Map Title')
plt.colorbar(ax=ax, label='Data Label')
保存或显示
plt.savefig('output.png', dpi=300, bbox_inches='tight')
plt.show()
应用场景
- 气象与气候分析:绘制温度、降水、气压等气象要素分布
- 海洋科学研究:可视化海温、洋流、盐度等海洋数据
- 环境监测:展示污染物扩散、植被指数变化
- 地理信息系统:创建专题地图、空间分析可视化
- 教育与科研:制作教学材料、科研成果展示图